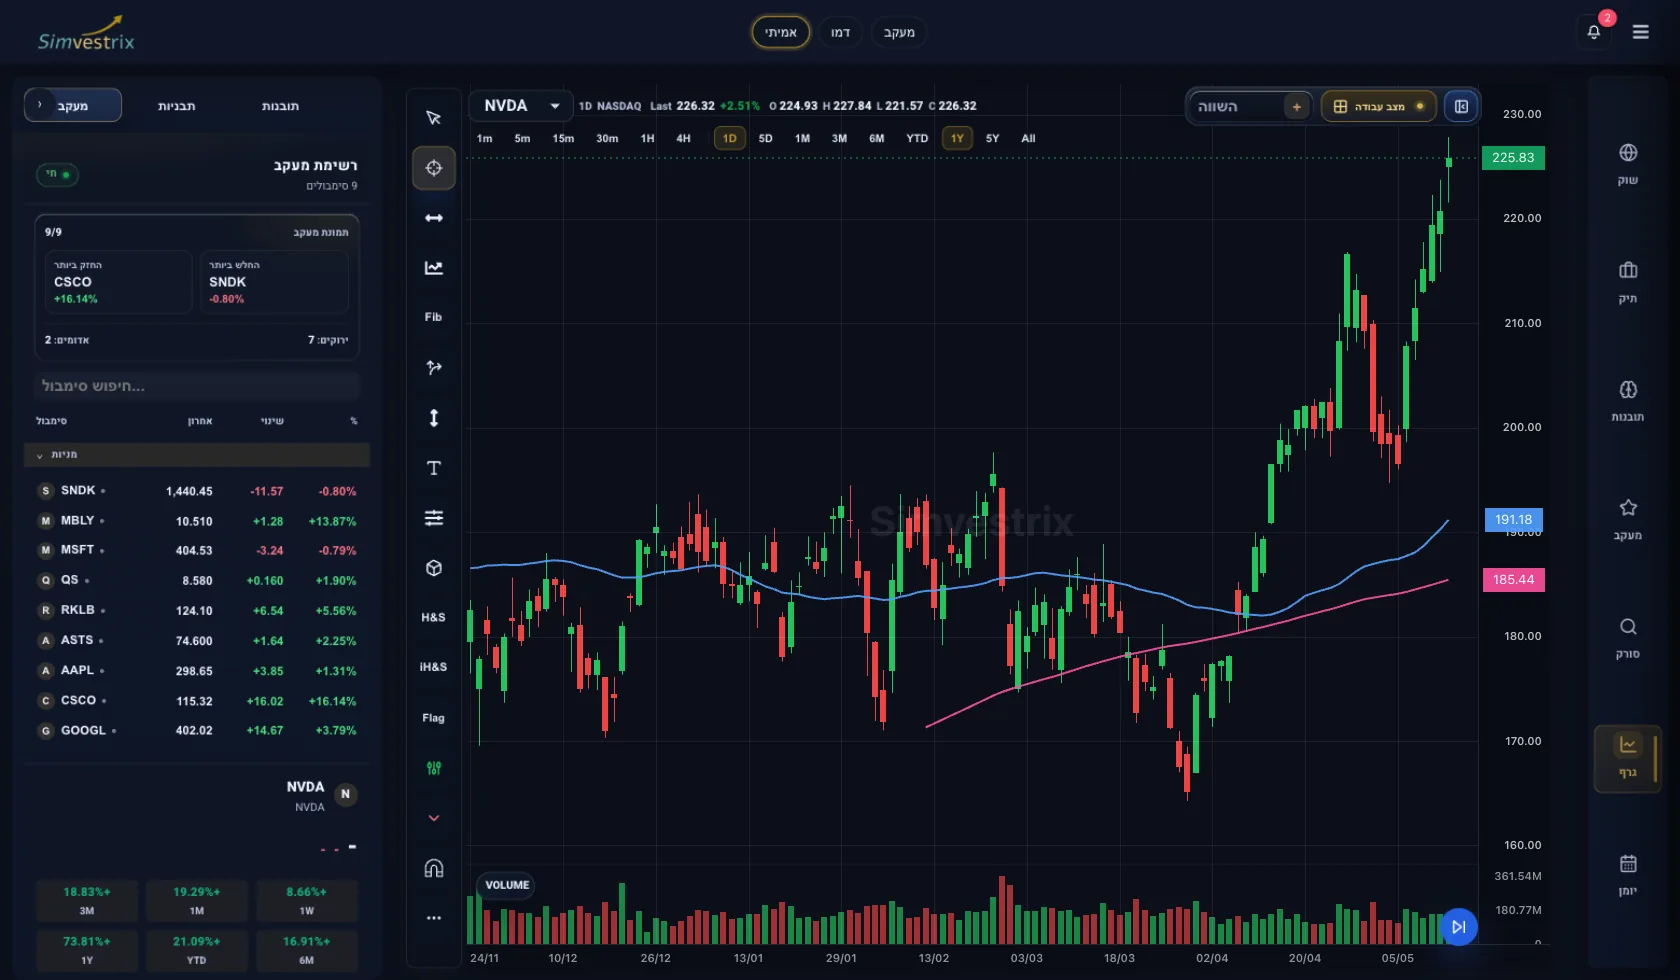
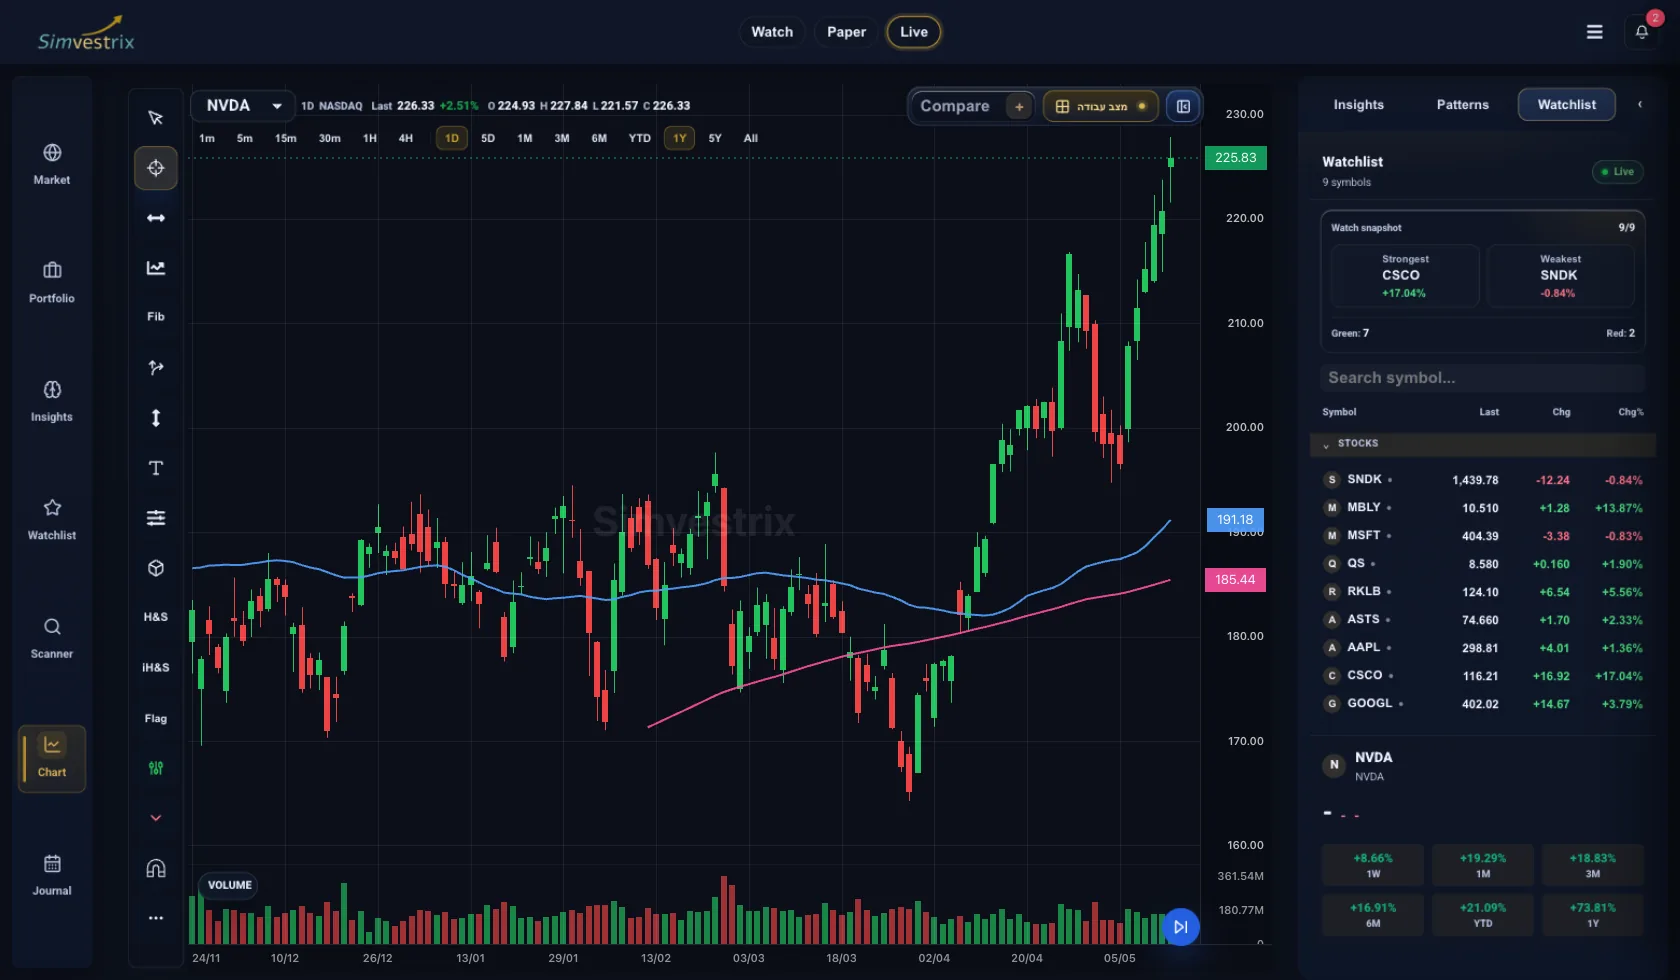
A stock can beat earnings, raise guidance, and still sell off by the close. That gap between company news and market behavior is exactly why traders ask what is stock technical analysis. At its core, technical analysis is the study of price, volume, and market structure to evaluate probabilities - not certainties - about where a stock may move next.
For independent traders, that distinction matters. Technical analysis does not try to estimate a company’s intrinsic value. It focuses on what the market is actually doing now, how it has behaved in similar conditions before, and where risk can be defined before a position is opened. Used well, it gives structure to trade selection, timing, and risk management. Used poorly, it turns into indicator clutter and false confidence.
What Is Stock Technical Analysis in Simple Terms?
Stock technical analysis is the process of examining charts and trading data to identify patterns, trends, momentum, and key price levels. The assumption is not that charts can predict the future with precision. The assumption is that price action reflects supply and demand, and that crowd behavior often leaves repeatable signals.
A technical trader is asking practical questions. Is this stock trending or range-bound? Is momentum strengthening or fading? Are buyers defending support? Is volume confirming the move, or is price drifting on weak participation? Those questions help turn a chart from a picture into a decision framework.
This is why technical analysis is so common among swing traders, active investors, and short-term market participants. It helps define entries, exits, and invalidation levels. If the setup fails, the trader knows where the idea broke. That kind of structure is often more useful than having a strong opinion with no plan.
The Core Idea Behind Technical Analysis
Technical analysis is built on three broad beliefs. First, market prices discount known information quickly. Second, price movements tend to form trends. Third, human behavior repeats, which means fear, greed, hesitation, and panic can show up in recurring chart patterns.
None of that means the market is mechanical. Context always matters. A clean breakout in a quiet tape behaves differently than a breakout during a Fed week or into earnings. Technical analysis works best when it is treated as a framework for managing probabilities under uncertainty, not as a promise that a pattern must resolve a certain way.
That is where many traders get it wrong. They look for a perfect signal instead of building a repeatable process. The stronger approach is to combine price behavior, volume confirmation, time frame alignment, and clear risk parameters.
The Main Tools Used in Stock Technical Analysis
Price is the primary input. Everything else is derived from it. Candlestick charts, line charts, and bar charts all present price differently, but candlestick charts are the standard because they show open, high, low, and close in a compact format.
Volume is the second major input. It helps answer whether a move has real participation behind it. A breakout above resistance on strong volume carries a different message than one that barely clears the level on light trading. Volume is not perfect confirmation, but it gives useful context.
Trendlines, support, and resistance levels are foundational. Support is an area where buyers have historically shown up. Resistance is where sellers have tended to step in. These are not exact numbers so much as zones of interest. Traders use them to map likely reaction areas and define risk.
Indicators come next, but they should stay in a supporting role. Moving averages can help smooth price action and identify trend direction. RSI can show momentum and potential overbought or oversold conditions. MACD can help track momentum shifts. The issue is not whether indicators work. The issue is whether the trader understands what each one is measuring and whether it fits the setup.
What Technical Analysis Looks Like in Practice
Suppose a stock has been forming higher highs and higher lows for several weeks. It pulls back into its 20-day moving average, volume dries up during the pullback, and then buying returns near a prior breakout zone. A technical trader may read that as a healthy retracement within an uptrend.
The trade idea is not just "the stock looks strong." It becomes more specific. Entry might be above the prior day’s high. The stop might sit below the pullback low. The target might be the next resistance area or a measured move based on the prior impulse. Risk is known before the trade is active.
Now change the context. The same chart pattern appears one day before earnings. That setup carries event risk that can overwhelm the technical picture. The chart still matters, but position sizing, timing, and expectations should adjust. This is where discipline separates chart reading from guessing.
What Is Stock Technical Analysis vs. Fundamental Analysis?
Fundamental analysis studies the business. It looks at revenue, earnings, margins, debt, valuation, competitive position, and broader economic conditions. Technical analysis studies the market’s behavior around that business.
The two approaches are not mutually exclusive. In fact, many traders use both. They may rely on fundamentals to build a watchlist of strong companies and then use technical analysis to time entries and manage positions. Others focus almost entirely on technicals because their holding period is short and price behavior matters more than long-term valuation.
The right mix depends on style. A long-term investor can tolerate noise that a swing trader cannot. A short-term trader needs a cleaner view of timing, volatility, and trade location. Technical analysis is especially useful when the goal is to act with precision rather than hold through broad uncertainty.
Where Technical Analysis Helps Most
Technical analysis is strongest when it improves decision quality. It helps traders identify trend conditions, spot possible reversals, measure momentum, and define trade levels before capital is at risk. It also supports consistency. If you review charts the same way every day, your process becomes easier to track and improve.
This is one reason workflow matters. Good analysis is not just about spotting a pattern on one screen. It is about connecting watchlists, chart review, position tracking, risk limits, and post-trade journaling into one system. A platform like Simvestrix fits naturally here because technical analysis is only one part of disciplined execution. The edge usually comes from how consistently the full process is managed.
The Limits of Technical Analysis
Charts do not remove uncertainty. They organize it. A support level can break. A breakout can fail. A textbook pattern can resolve in the wrong direction because market conditions changed, liquidity disappeared, or news hit at the wrong moment.
That is why technical analysis should never stand alone without risk management. A chart can suggest where a trade idea is invalidated, but the trader still has to respect that level. Without stop discipline, position sizing, and review, even a solid analytical method can produce poor results.
There is also the problem of overfitting. Traders often stack multiple indicators that all measure similar things and mistake agreement for confirmation. In reality, they are just getting the same message dressed up in different formulas. Simpler frameworks are usually more durable.
Common Mistakes Newer Traders Make
One common mistake is treating every pattern as tradable. A flag in a strong market and a flag in a weak, choppy market are not the same setup. Context matters as much as pattern shape.
Another mistake is ignoring time frame alignment. A daily chart may look bullish while the weekly chart is pressing into major resistance. Or a 15-minute breakout may be fighting a broader downtrend. Technical analysis gets stronger when the trader knows which time frame is driving the decision.
The third mistake is failing to review outcomes. If a trader keeps taking the same setup but has no data on win rate, average return, drawdown, or failure conditions, there is no real feedback loop. Technical analysis becomes much more effective when chart ideas are tied to trade journaling and performance review.
Building a Better Technical Analysis Process
A stronger process starts with fewer variables, not more. Track trend, key levels, volume behavior, and one or two momentum measures. Define what qualifies as a setup, what invalidates it, and how much capital is at risk. Then review the result after the trade closes.
The goal is not to be right on every chart. The goal is to make repeatable decisions with clear reasoning. Over time, that creates something more valuable than a favorite indicator. It creates operational discipline.
If you are still asking what is stock technical analysis, the shortest answer is this: it is a way to read market behavior so you can make better-structured trading decisions. The chart will never do the job for you. But when your analysis, risk controls, and review process work together, it becomes a practical edge instead of just another opinion on price.