Most traders do not struggle because charts are too complex. They struggle because they try to learn everything at once, mix opinions with process, and never build a repeatable review loop. If you want to know how to learn stock technical analysis, the fastest path is not more indicators. It is better structure.
Technical analysis is the study of price, volume, and market behavior on a chart. That sounds simple, but the real skill is interpretation under uncertainty. A chart can show strength, weakness, compression, momentum, exhaustion, or indecision. Your job is not to predict every move. It is to read evidence, define risk, and make decisions with consistency.
How to learn stock technical analysis without getting stuck
The mistake most beginners make is treating technical analysis like a catalog of patterns to memorize. They jump from candlesticks to Fibonacci levels to oscillators to complex strategies, then end up with a screen full of signals and no conviction. A better approach is to learn in layers.
Start with market structure. Before you add any tool, learn to identify trend, support, resistance, and volatility. Ask basic questions first. Is the stock making higher highs and higher lows, or lower highs and lower lows? Is price expanding cleanly or chopping in a range? Where has the market repeatedly reacted before?
This matters because every other tool sits on top of that foundation. A moving average crossover means one thing in a trending market and something very different in a noisy range. RSI can flag momentum continuation in one context and a false reversal in another. Without context, indicators turn into distractions.
The next layer is volume. Price shows what happened. Volume helps frame how committed market participants were to that move. A breakout on strong volume often deserves more attention than one that drifts above resistance with little participation. Volume is not a guarantee, but it adds weight to the read.
Only after that should you begin adding a small number of indicators. Keep it tight. One trend tool and one momentum tool are usually enough for learning. More tools do not automatically create better analysis. They often create conflicting inputs and slower decisions.
Build a learning sequence that mirrors real trading
If your goal is practical skill, study technical analysis in the order you would actually use it.
1. Learn to read clean charts
Use simple price charts first. Candlesticks are useful, but the pattern names matter less than the message inside the bar. Did buyers hold gains into the close? Did sellers reject higher prices? Was the session narrow and quiet or wide and aggressive? Read the bar in relation to the bars around it.
Then move to multi-timeframe analysis. A daily chart might show a stock breaking out, while the weekly chart shows price running directly into a major resistance zone. Both can be true. Good traders learn to hold more than one timeframe in view because trade quality often depends on where short-term setups sit inside bigger structure.
2. Focus on a few core concepts
You do not need a massive technical vocabulary to become effective. You need working competence in a few concepts that appear constantly: trend, support and resistance, consolidation, breakout, pullback, momentum, and relative strength.
Relative strength is especially useful because not all charts move with equal quality. In the same market environment, some stocks will lag while others keep attracting buyers. Learning to compare one stock’s behavior to its sector or the broader market can sharpen selection.
3. Add indicators carefully
Use indicators to support chart reading, not replace it. A moving average can help define trend direction and dynamic support or resistance. RSI or MACD can help you judge momentum. But the trade-off is clear: indicators simplify information while also introducing lag.
That means they work best when you already understand what price is doing. If you use indicators as a substitute for reading structure, you will often enter late, exit late, or act on weak signals. Start with one or two, then test whether they genuinely improve your decision-making.
4. Study risk at the same time
Technical analysis without risk management is incomplete. Every chart setup is a probability, not a promise. As you learn entries, also learn invalidation. Where is the trade wrong? How much are you willing to lose if the setup fails? Does the potential reward justify the risk?
This is where many self-directed traders improve fastest. The chart may help generate ideas, but risk rules keep small mistakes from becoming major drawdowns. If your analysis does not include position sizing and exit planning, it is not ready for live capital.
What to practice every week
Reading about technical analysis helps, but chart time is what builds skill. The best practice is focused repetition with review.
Start by marking up charts manually. Pick a small set of stocks and identify the trend, key levels, and current phase. Note where breakouts held, where they failed, and how volume behaved around inflection points. Do not rush this. Pattern recognition develops through repetition, not speed.
Then build a watchlist with purpose. Separate stocks by setup type rather than dumping everything into one list. You might track trend continuation names, pullback candidates, range breakouts, and weak charts near support failure. This makes your analysis more organized and helps you compare similar structures side by side.
A journal is just as important as chart study. After every trade, record what you saw, why you entered, what your risk was, and how the trade actually behaved. Over time, your journal will show whether your edge is real or imagined. It will also expose recurring errors, such as chasing extension, entering before confirmation, or sizing too aggressively.
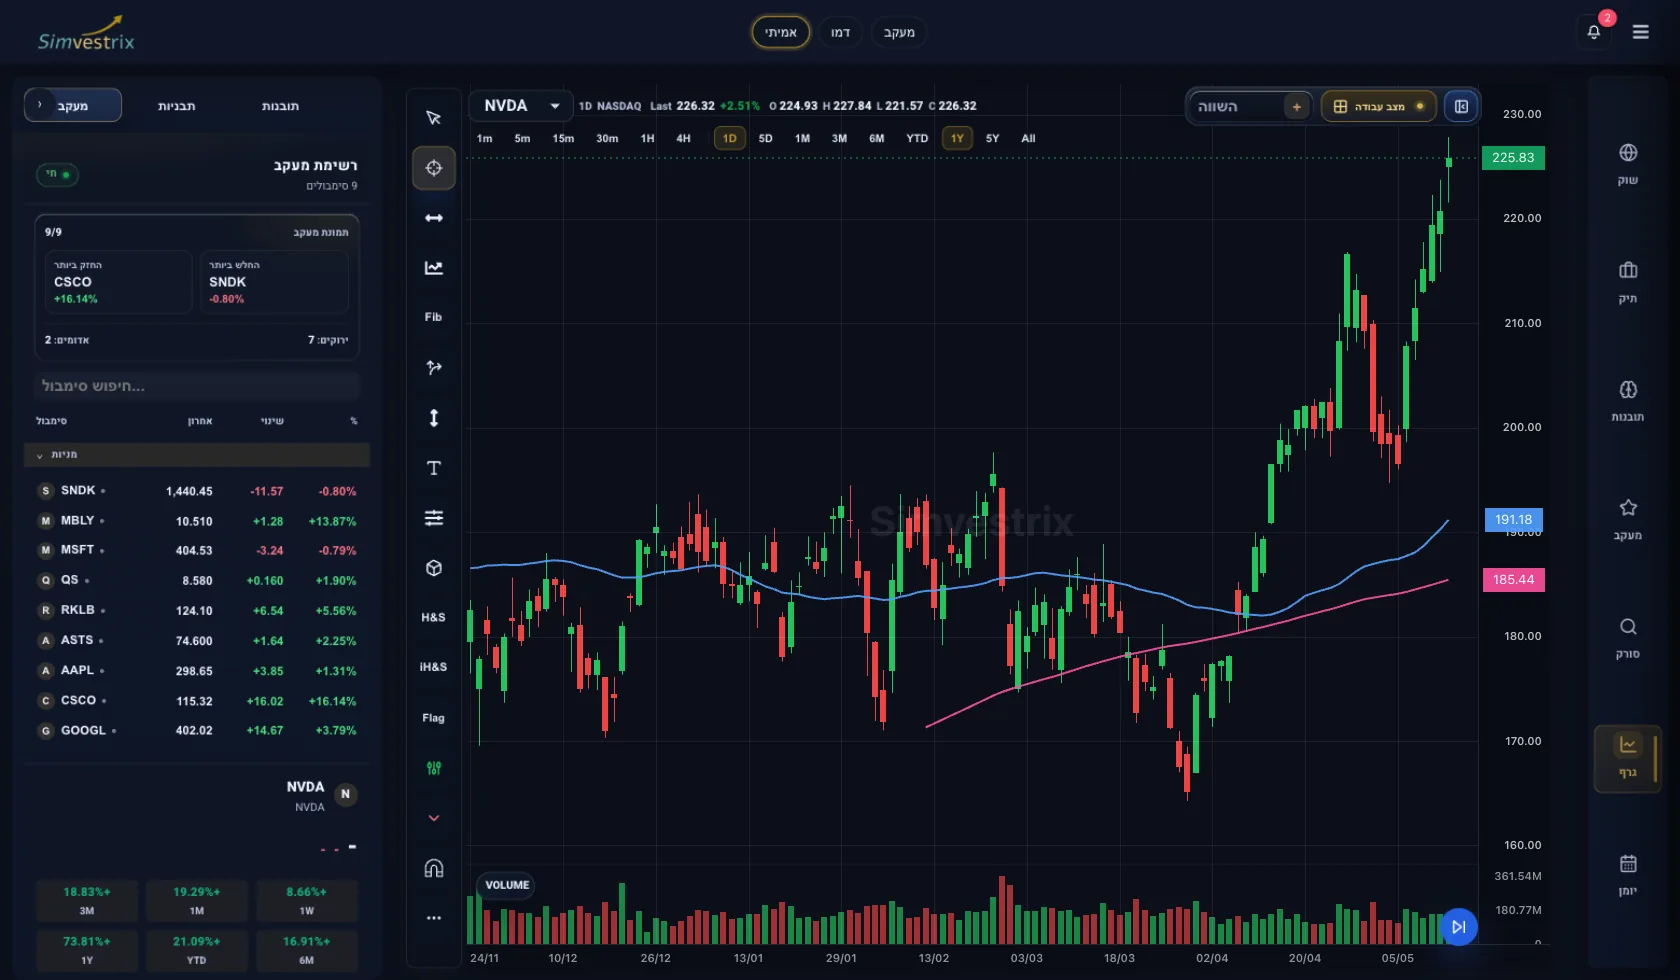
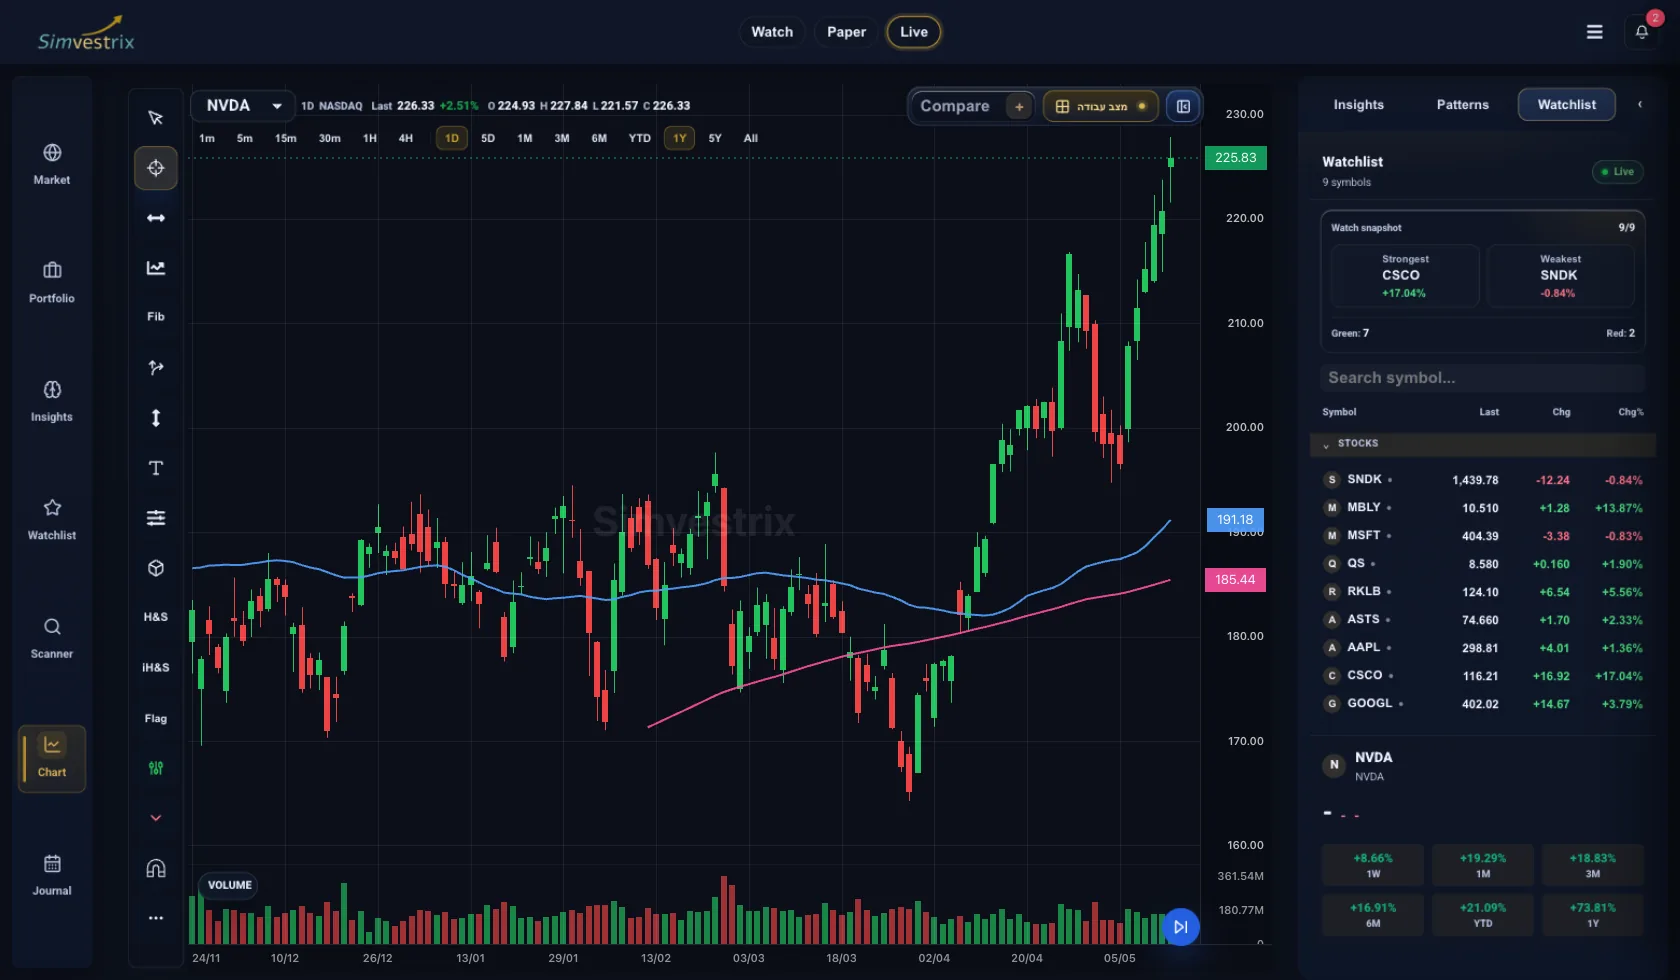
This is where an integrated workflow matters. When charting, watchlists, risk management, and trade review sit in separate tools, traders often lose continuity between analysis and execution. A connected workspace like Simvestrix makes it easier to move from setup identification to position oversight to post-trade review without that fragmentation.
Common traps when learning technical analysis
One of the biggest traps is searching for certainty. Technical analysis does not remove uncertainty. It helps you organize it. Even the cleanest chart can fail on news, market rotation, or broader risk-off conditions. The goal is not perfect prediction. It is favorable odds with controlled downside.
Another trap is overfitting. Traders often study charts until they can explain every past move, then assume they have found a reliable pattern. But the market always looks clearer in hindsight. A useful framework must work in real time, with incomplete information and emotional pressure.
There is also the problem of tool overload. More indicators, more scans, and more screens can feel productive, but they often reduce clarity. If your process requires ten conditions to align before you can act, you may be solving for comfort rather than edge.
Finally, many traders separate technical analysis from market conditions. That is a mistake. A breakout strategy that works in a strong trending tape may underperform badly in a choppy, headline-driven market. Context changes the quality of signals. Your learning process should include market regime awareness, not just stock-specific setups.
How to know you are getting better
Progress in technical analysis is not measured by how many patterns you can name. It shows up in sharper decision quality.
You are improving when you can explain a chart clearly in plain language, without hiding behind jargon. You are improving when your trade plans include entry, stop, target, and invalidation before the order is placed. You are improving when your review process can separate a good trade that lost from a bad trade that happened to win.
You should also see your process becoming more efficient. Better traders spend less time hunting randomly and more time working from structured watchlists, repeatable criteria, and post-trade feedback. They are not guessing less because the market is easier. They are guessing less because their framework is tighter.
A practical path for the next 60 days
If you want a realistic way to learn, keep the next two months narrow. Spend the first few weeks on pure chart structure and trend identification. Then add volume and one momentum tool. In the following weeks, focus on one or two setup types only, such as pullbacks in uptrends or breakouts from consolidation. Track every example you see, including the ones you do not trade.
At the same time, review your work weekly. Which setups behaved well? Which failed quickly? Did your stop placement make sense relative to the chart? Were you trading the setup, or trading boredom? That review layer is what turns chart study into actual skill.
Technical analysis rewards discipline more than cleverness. The traders who improve are usually not the ones chasing the newest signal. They are the ones building a clean process, keeping records, and learning to read price with less noise and more control. Start there, and your charts will begin to make sense for the right reason.