Most traders know their P&L. Far fewer know what their portfolio is actually doing.
That gap matters. If you want to understand how to track portfolio performance, you need more than a green or red number on the screen. A portfolio can be profitable while taking too much risk, leaning too hard on one theme, or producing returns that look better than they really are because cash flows and position sizing are distorting the picture.
Serious performance tracking is not about collecting more stats for the sake of it. It is about building a clear operating view of what is working, what is leaking capital, and where your process needs adjustment.
What portfolio performance actually means
Portfolio performance is the combination of return, risk, consistency, and context. Return tells you what you made or lost. Risk tells you what you had to tolerate to get there. Consistency shows whether results come from a repeatable process or a few outsized wins. Context tells you whether your portfolio did well relative to your strategy, your benchmark, and the market conditions you traded through.
That last part gets missed often. A 12% gain can be strong or weak depending on the exposure you carried. If your portfolio was heavily concentrated in a market that rose 25%, you did not outperform just because you made money. If you held significant cash and still produced positive risk-adjusted returns during a volatile stretch, that may be a stronger result than the raw number suggests.
This is why portfolio tracking needs structure. Looking only at account balance changes will not give you enough control.
How to track portfolio performance without fooling yourself
Start by separating account activity from investment performance. Deposits, withdrawals, transfers, and dividend payments can all affect the account value without reflecting trading skill. If you do not isolate those flows, your numbers will be noisy and sometimes misleading.
The cleanest approach is to track performance across a consistent set of measurements. You do not need an institutional analytics stack, but you do need a disciplined framework. In practice, that means monitoring portfolio value over time, measuring percentage return, comparing results to an appropriate benchmark, and reviewing drawdowns and volatility alongside gains.
It also means deciding what period matters. Day-to-day changes are useful for active monitoring, but they are often too noisy to judge process quality. Weekly and monthly reviews usually reveal more. Quarterly review can help you spot deeper structural issues such as sector concentration, style drift, or a strategy that only works in one market regime.
Start with total return, not just P&L
P&L is a snapshot. Total return is a fuller measure. It captures the portfolio's change in value over a period, including realized gains, unrealized gains, dividends, interest, and other income.
For active traders, this distinction matters because open positions can create a large gap between closed-trade results and actual portfolio behavior. You may have a strong realized gain record while carrying unrealized losses that are eroding overall performance. The opposite can happen too. A portfolio may look quiet in closed-trade reports while unrealized gains are doing most of the work.
Track total return as a percentage, not only in dollars. Dollar gains matter, but percentage return gives you a clearer basis for comparing one month to another, one strategy to another, or your portfolio to a benchmark.
Use the right return method
If you add or withdraw capital during the period, simple start-to-end return can become unreliable. This is where traders often misread their own results.
Time-weighted return is useful if you want to evaluate the performance of the portfolio itself, independent of cash flows. Money-weighted return is more relevant if you want to measure the return on your actual invested capital, including when you added or removed funds. Neither is universally better. It depends on the question you are asking.
For many independent traders, time-weighted return is the cleaner choice when reviewing strategy performance. It keeps deposits from looking like gains and withdrawals from looking like losses.
Benchmarking is part of performance tracking
A portfolio should be measured against something relevant. That does not always mean the S&P 500.
If you trade large-cap US equities with moderate exposure, a broad equity benchmark may make sense. If you trade a concentrated swing strategy, options-heavy positions, or a multi-asset book with large cash swings, a standard benchmark may be less useful on its own. In that case, you may need a blended benchmark or at least a custom comparison framework that reflects your actual opportunity set.
The goal is not to force your strategy into a generic market comparison. The goal is to understand whether your returns justify your approach. A portfolio that lags a benchmark slightly but does so with materially lower drawdown may still be performing well. A portfolio that beats the benchmark while taking double the risk needs a more skeptical review.
Watch drawdown as closely as return
If return is the headline number, drawdown is the stress test.
Maximum drawdown shows the largest peak-to-trough decline in your portfolio over a period. It tells you what the portfolio gave back before recovering, if it recovered at all. For active traders, this metric often says more about process quality than average return.
A portfolio that compounds steadily with shallow drawdowns is easier to size, easier to stick with, and usually easier to improve. A portfolio with sharp drawdowns may still be profitable, but it creates more pressure on risk control and trader psychology. If your gains depend on surviving large equity swings, the strategy may be less durable than it first appears.
Metrics that actually help improve decisions
You do not need twenty metrics. You need the ones that change behavior.
Win rate has value, but only when paired with average win, average loss, and expectancy. A high win rate can hide poor risk-reward. A lower win rate can still produce strong results if winners are sized well and losses stay controlled.
Volatility is also useful, especially at the portfolio level. It shows how unstable your returns are over time. High volatility is not automatically bad, but it raises the bar for position sizing and risk tolerance.
Exposure is another key input. Two portfolios with the same return can be very different if one was fully invested and the other held large cash reserves. Gross and net exposure help explain how aggressively the portfolio was positioned.
Contribution by asset, sector, or strategy is where performance tracking becomes operational. You want to know which positions generated gains, which themes consistently hurt results, and whether one part of your process is subsidizing another. Without this breakdown, it is easy to keep trading setups that feel productive but are net negative over time.
Build a review process, not just a dashboard
Good tracking is not passive. The numbers only matter if they feed review.
A practical workflow is simple. Monitor portfolio value and exposure daily. Review return, benchmark comparison, and drawdown weekly. Review attribution, trade quality, and recurring mistakes monthly. That cadence gives you enough frequency to stay in control without overreacting to noise.
The most useful review questions are specific. Did performance come from a repeatable setup or a few outliers? Were gains concentrated in one symbol or sector? Did risk expand during weak periods? Were losses caused by bad entries, oversized positions, poor exits, or simply normal variance?
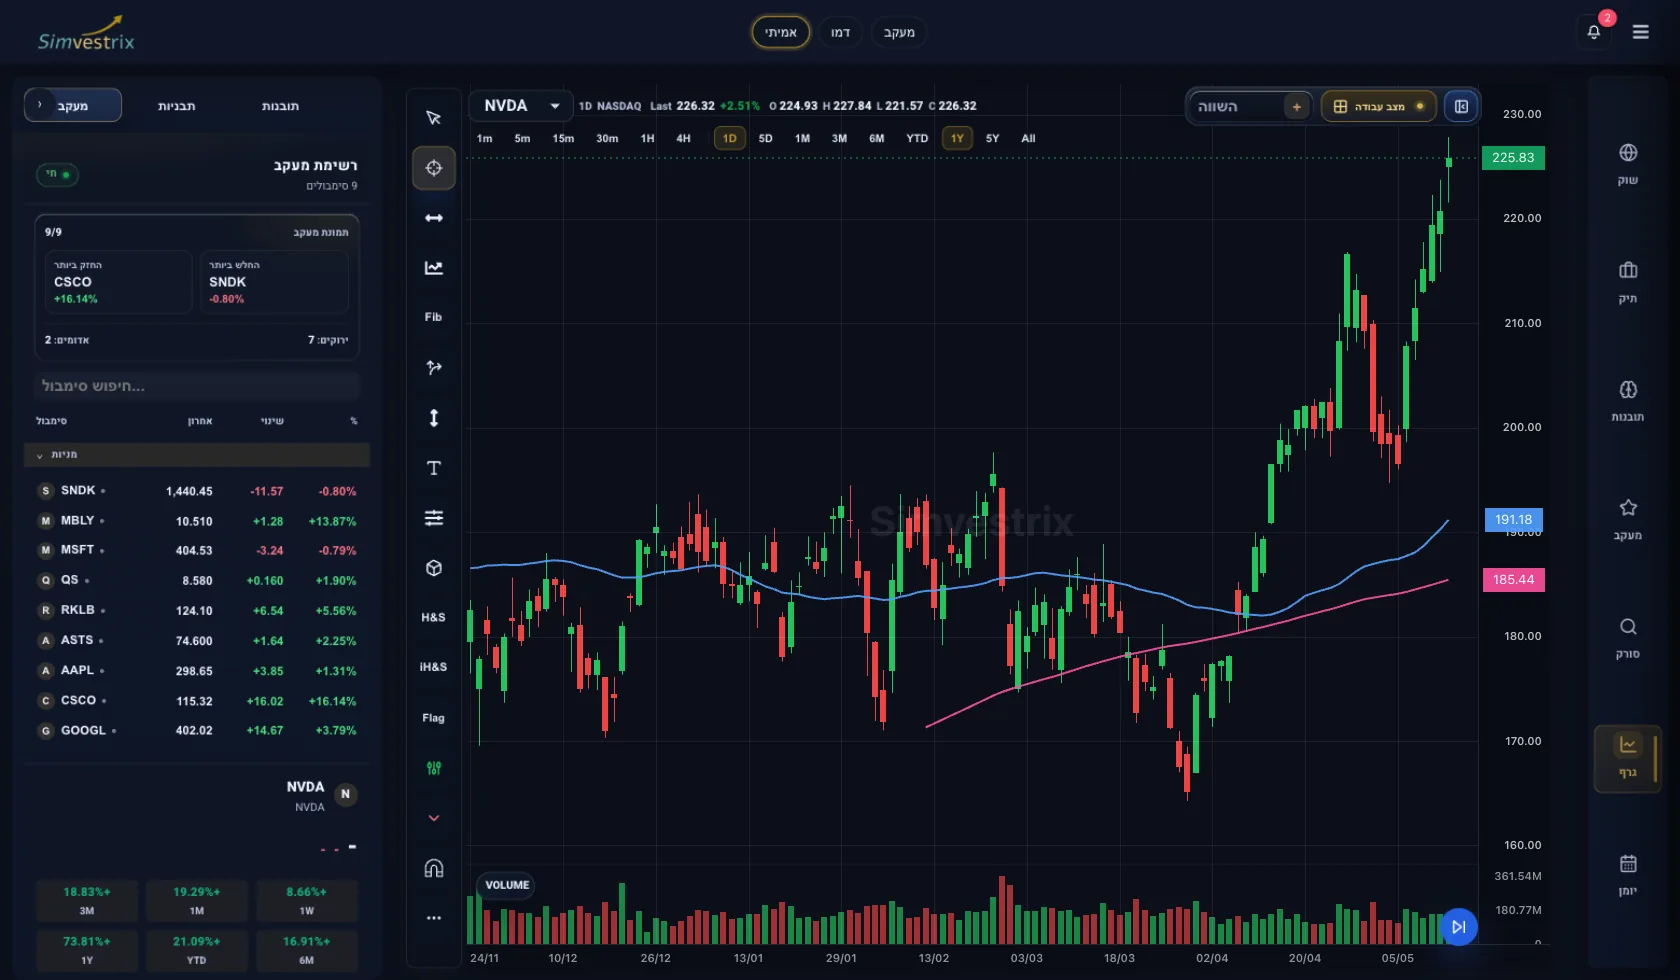
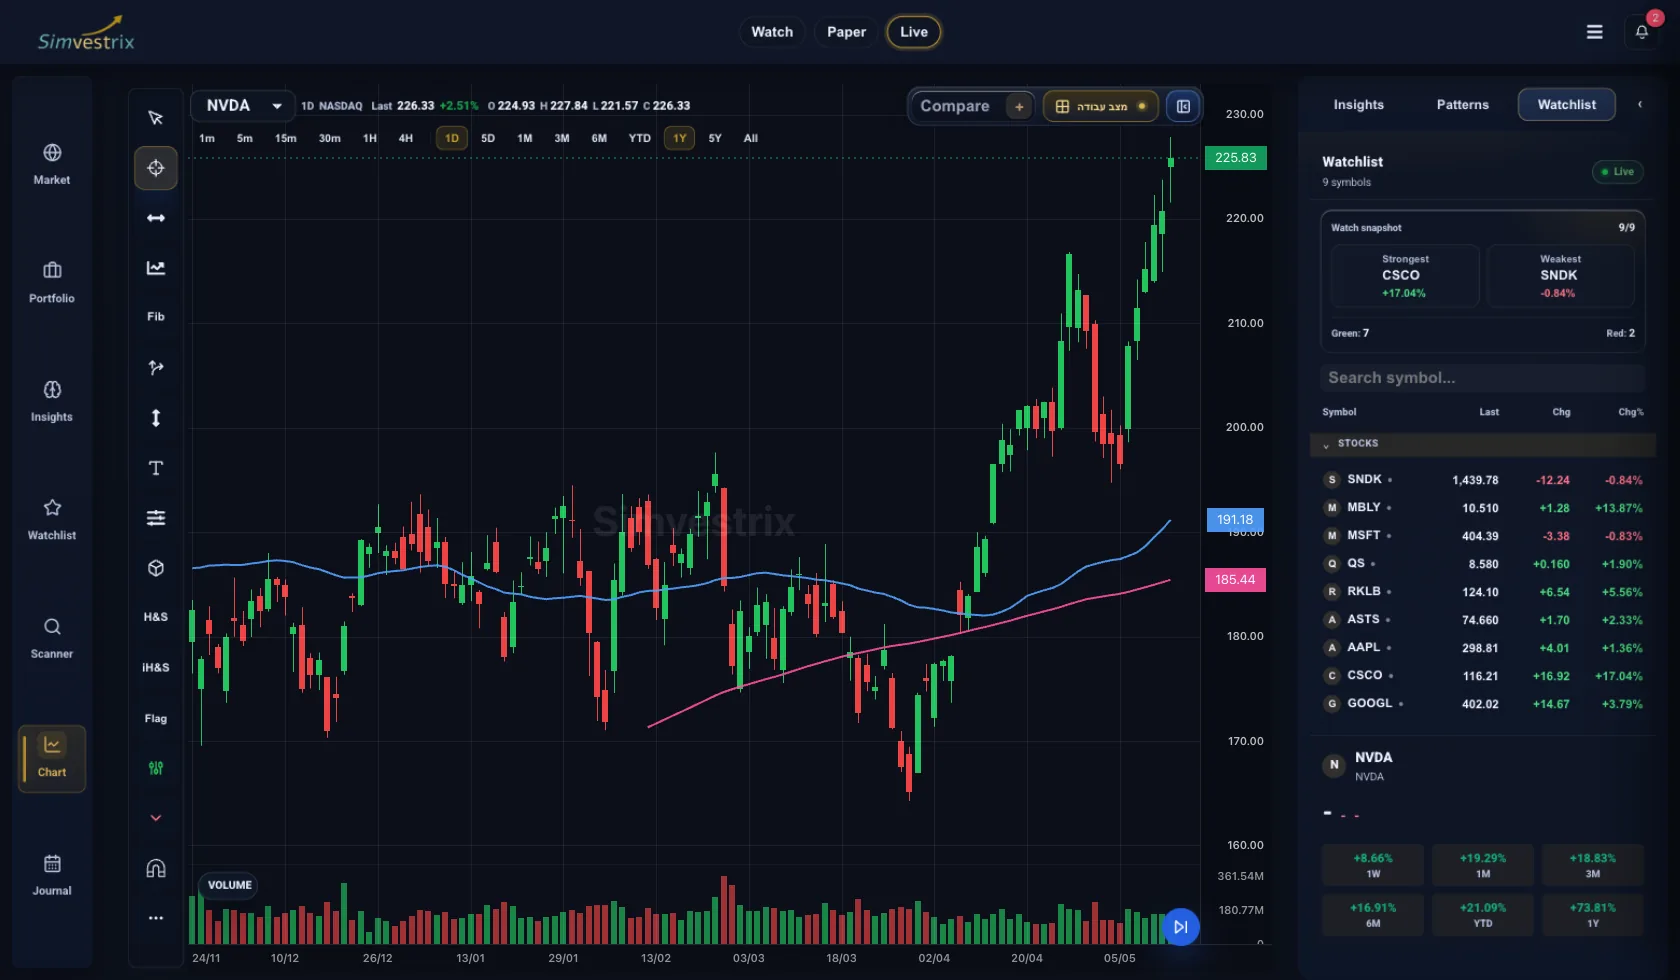
This is where an integrated workspace has an edge. When chart analysis, watchlists, journaling, portfolio tracking, and risk management live in the same environment, performance review gets sharper. You can move from outcome to cause faster. That is the difference between seeing that you underperformed and understanding why.
Common mistakes when tracking portfolio performance
The biggest mistake is focusing only on returns. The second is reviewing too loosely to spot patterns.
Many traders also mix portfolio tracking with trade tracking as if they are the same thing. They are related, but not identical. A trade journal helps you improve execution and setup selection. Portfolio tracking helps you understand aggregate exposure, risk concentration, and capital efficiency. You need both.
Another common issue is using inconsistent time frames. If you compare a one-month portfolio return to a benchmark's year-to-date move, the conclusion will be weak. Consistency matters.
Finally, avoid metric overload. If your review process is packed with numbers you do not use, your attention gets diluted. A smaller set of trusted metrics reviewed consistently is better than a large analytics panel you ignore.
The standard for serious traders
If you are learning how to track portfolio performance, aim for clarity over complexity. Know your total return. Adjust for cash flows. Compare against a relevant benchmark. Track drawdowns, exposure, and contribution. Then review the numbers on a schedule tight enough to improve decisions, but not so tight that noise runs the process.
Performance tracking should make your trading more controlled, not more complicated. When the workflow is connected and the data is visible in one place, you spend less time reconciling tools and more time improving decisions. That is where disciplined traders gain ground.